Mario.Tapilouw

Thursday, March 24, 2011

haven't written any code yet...

It has been almost three months in 2011, I haven't written any serious C++ code yet. Recently I've been fixing memory leak errors in a software, playing with some openGL stuffs and lots of matlab stuffs.

I'm planning to write something about simple image processing algorithms and examples with a webcam, the easiest and cheapest way of giving real time examples (which is quite impressive and efficient).


Another thing is about plane fitting, I'm planning to use OpenCV matrix library for doing plane fitting. This will be very useful for me and hopefully for all of you too. I use matlab to perform this I can imagine how to convert this into C++, what I need is some time and a clear mind. :)

So, stay tune...

Labels: ,

Thursday, August 26, 2010

Line fitting in Matlab

I've been using this for several times but I always forget where I put the source code, so every time I have to rewrite it again. So, I think it would be better if I put the source code here so it will be easier for me to find if I need this again.
This is almost the same with the article that I wrote using GSL, I use Matlab because I need to show the 3D, I haven't finished my 3D visualization software yet.
So here we go:
- Assume that you have a line data, Y(1:540) which are changing with the X value, X(1:540).
- Then basically, you just have to call this polynomial fitting function in Matlab: p = polyfit(X,Y,n);
- The result from this function is an array p which has n+1 element and representing the coefficient of the polynomial equation p1*x^(n) + p2*x^(n-1) + ... + p(n+1). for example if n = 1, then the equation will be p(1).x - y2 + p(2) = 0.
- To generate the line, simply plot the equation to the X value, for example:
for col=1:1:540
y2(col) = p(1)*x(col) + p(2);
end
plot(x, y, x, y2);


- To get the difference between the line and the actual values, the distance from point to a line formula can be used.
for col=1:1:540
d(col) = (p(1)*x(col) - Y(col) + p(2)) / sqrt( (p(1)*p(1))+1 );
end
- Then you can show the deviation in another figure.


Hope it helps.
Good luck.


Labels: , ,

Monday, October 26, 2009

Camera Calibration using OpenCV

Actually this is one of the thing that I wanted to try last two year but at that time I didn't understand how to use it so I left it. But right now I have understood how to use this, so I would like to share it with you.

The usage is very simple. If you have already succeeded with capturing webcam using OpenCV, this example will be a lot more fun than that :D.

Suppose you have already connect your webcam to be captured using OpenCV, what you need to do is preparing these variables:

int patternCol(7);
int patternRow(4);
int numOfCorner(28);
int cornerCount(0);
int nBoards(8);
int successes(0);
int step(0);
CvPoint2D32f *cornerPoints;

Remember that you need to initialize the cornerPoints using new because it's a dynamic array.

Then, you need to add these lines into the callback of your webcam, suppose the variable of your callback is image:

int found = cvFindChessboardCorners(image, boardSize, cornerPoints, &cornerCount, CV_CALIB_CB_ADAPTIVE_THRESH);
cvDrawChessboardCorners(image, boardSize, cornerPoints, numOfCorner, found);

What you will see is that the chessboard corners are marked with a circle. If the circle has different colors, then it means the algorithm is successful. Something like this:

Then, the next thing you have to do is to save the position of the corners into a variable until you have enough images to perform the camera calibration. I tried using only 8 images, you can try more. I set the number of images using nBoards variable.

if( cornerCount == numOfCorner )
{
for( int i=step, j=0; j <>
{
CV_MAT_ELEM( *image_points, float, i, 0 ) = cornerPoints[j].x;
CV_MAT_ELEM( *image_points, float, i, 1 ) = cornerPoints[j].y;
CV_MAT_ELEM( *object_points, float, i, 0 ) = j/patternCol;
CV_MAT_ELEM( *object_points, float, i, 1 ) = j%patternRow;
CV_MAT_ELEM( *object_points, float, i, 2 ) = 0.0f;
}
CV_MAT_ELEM( *point_counts, int, successes, 0 ) = nBoards;
successes++;
}

Then, the next thing is to calibrate the camera using these lines of code:
CvMat* object_points2 = cvCreateMat( successes*nBoards, 3, CV_32FC1 );
CvMat* image_points2 = cvCreateMat( successes*nBoards, 2, CV_32FC1 );
CvMat* point_counts2 = cvCreateMat( successes, 1, CV_32SC1 );

// Transfer the points into the correct size matrices
for( int i = 0; i <>
{
CV_MAT_ELEM( *image_points2, float, i, 0) = CV_MAT_ELEM( *image_points, float, i, 0 );
CV_MAT_ELEM( *image_points2, float, i, 1) = CV_MAT_ELEM( *image_points, float, i, 1 );
CV_MAT_ELEM( *object_points2, float, i, 0) = CV_MAT_ELEM( *object_points, float, i, 0 );
CV_MAT_ELEM( *object_points2, float, i, 1) = CV_MAT_ELEM( *object_points, float, i, 1 );
CV_MAT_ELEM( *object_points2, float, i, 2) = CV_MAT_ELEM( *object_points, float, i, 2 );
}

for( int i=0; i <>
{
CV_MAT_ELEM( *point_counts2, int, i, 0 ) = CV_MAT_ELEM( *point_counts, int, i, 0 );
}

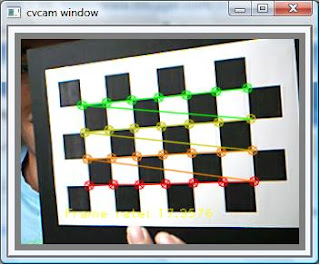
// At this point we have all the chessboard corners we need
// Initiliazie the intrinsic matrix such that the two focal lengths
// have a ratio of 1.0

CV_MAT_ELEM( *intrinsic_matrix, float, 0, 0 ) = 1.0;
CV_MAT_ELEM( *intrinsic_matrix, float, 1, 1 ) = 1.0;

// Calibrate the camera
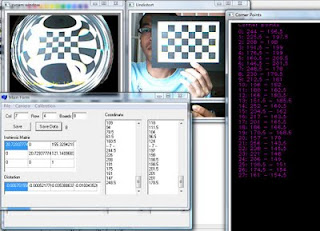
cvCalibrateCamera2( object_points2, image_points2, point_counts2, cvSize( image->width, image->height ),intrinsic_matrix, distortion_coeffs, NULL, NULL, CV_CALIB_FIX_ASPECT_RATIO );

the output of the calibration is these two matrices: intrinsic_matrix, distortion_coeffs. You can save it into a file using cvSave(...) or directly call it from somewhere in your program.

These are some excerpts of the steps that I implement in my program. I followed the examples provided in Chapter 11 of OpenCV book :). If you're interested just try it :D


Wait for my next post about why this camera calibration stuff is important, hehehe... :D

Labels: , , , , ,

Friday, September 11, 2009

Real Time chart using OpenCV

If you need a chart that is fast and need to be updated in real time, this article might be useful for you. I have been searching for real time charting but I couldn't find one. But it happened to be creating your own is not that difficult, so why not creating your own charting tools.

What you will need is OpenCV Library that has been installed and configured properly in your computer. If you don't know how to install and configure one, you can start by searching a tutorial using "OpenCV Installation" as the keywords in Google and you will find plenty of them.

Start by creating an object of IplImage, something like this:
IplImage *avtImgProfile;

Then, you might need to define some color lines and font for descriptions, like this:
CvScalar greenLine;
CvScalar redLine;
CvScalar blueLine;
CvScalar whiteLine;
CvFont font;

These color lines and fonts need to be initialized prior to use, the color can be initialize as follow:
greenLine = cvScalar(0, 255, 0);
redLine = cvScalar(0, 0, 255);
blueLine = cvScalar(255, 0, 0);
whiteLine = cvScalar(255, 255, 255);

The font can be initialized as follow:
cvInitFont(&font, CV_FONT_HERSHEY_PLAIN, 1.0, 1.0, 0, 1, 8);

Then, if you have an array of data, for example from a matrix, you can iterate the data and draw it as a circle, or anything you need. I use circle for simplicity reason.

for(int i=0;icols;i++)
{
int height = avtLineMat->data.ptr[i];
int posx = textOffset + i;
int posy = zeroPos - height;
cvCircle(avtImgProfile, cvPoint(posx, posy), 1, whiteLine, 1);
}

You might need some description about the Chart, the axis and the Title, simply by adding these lines:

cvPutText(avtImgProfile, "Cross Section Profile", cvPoint(200, 15), &font, whiteLine);
cvPutText(avtImgProfile, "Pos.(pixel)", cvPoint(550, 290), &font, whiteLine);
cvPutText(avtImgProfile, "Int.(gray)", cvPoint(10, 15), &font, whiteLine);

And also you might need to add horizontal and vertical axis, such as:
cvLine(avtImgProfile, cvPoint(textOffset , textOffset ), cvPoint(textOffset ,300), whiteLine, 1);
cvLine(avtImgProfile, cvPoint(0, zeroPos ), cvPoint(669, zeroPos ), whiteLine, 1);

Then after finished iterating the data, you can show it using OpenCV display, like this:
cvShowImage("cross section profile", avtImgProfile);

And as a result, you will got is something like this:


So far, this chart can be updated in real time for a 200 fps camera by embedding this function in the callback.

I haven't tried it with a higher speed camera, and I might need to measure the speed of the display and try to make it faster.

Labels: , , , ,

Friday, February 13, 2009

Setting Minimum and Maximum Window Size on Visual C++

If you're using dialog based UI, it's quite simple. Just add this line in the MessageMap

BEGIN_MESSAGE_MAP(CDialogDlg, CDialog)
... ON_WM_GETMINMAXINFO()
END_MESSAGE_MAP()


and then add the function into your dialog class:


void CDialogDlg::OnGetMinMaxInfo( MINMAXINFO FAR* pMinMaxInfo )
{
// Preferred Maximum X & Y.
const int MAX_SIZE_X = 750;
const int MAX_SIZE_Y = 650;
// Preferred Minimum X & Y.
const int MIN_SIZE_X = 400;
const int MIN_SIZE_Y = 350;
// Set the maximum size. Used while maximizing.
pMinMaxInfo->ptMaxSize.x = MAX_SIZE_X;
pMinMaxInfo->ptMaxSize.y = MAX_SIZE_Y;
// Set the Minimum Track Size. Used while resizing.
pMinMaxInfo->ptMinTrackSize.x = MIN_SIZE_X;
pMinMaxInfo->ptMinTrackSize.y = MIN_SIZE_Y;
// Set the Maximum Track Size. Used while resizing.
pMinMaxInfo->ptMaxTrackSize.x = MAX_SIZE_X;
pMinMaxInfo->ptMaxTrackSize.y = MAX_SIZE_Y;
}


Don't forget to enable the Minimize and Maximize box in your dialog, then Voila.. your dialog box will changed.

Labels: , , ,